The Battle of the Neighbourhoods
Written By Alex Lynn
This article was written as the final assignment for my IBM Data Science Professional Certificate.
Below are links to the Jupyter Notebook and the PDF report.
This research is intended on finding the best suitable location for a Peruvian restaurant in the city of Cambridge, UK. The report is designed for any stakeholder who would like to make a calculated risk before leasing a retail space.
This research is intended on finding the best suitable location for a Peruvian restaurant in the city of Cambridge, UK. The report is designed for any stakeholder who would like to make a calculated risk before leasing a retail space.
The main criteria for this report are to find a location that is close to an area where there is a good choice of entertainment, but where there are not any restaurants that provide similar cuisine type (e.g.Mexican, Brazilian etc).
Cambridge is a city with a big demographic of tourists and foreign students, so appealing to a type of cuisine that does not exist in the market could prove profitable for the stakeholder.
Latin American food is always popular, and Peruvian food is surging in global popularity currently with several Peruvian chefs winning coverted culinary prizes in the last few years.
As of current statistics these are the 5 most popular restaurant cuisines in the UK so there is a gap in the market for emerging food trends. The report will look to examine whether Cambridge fits into the same generalised food choice as the rest of the UK.
- Pub Food
- English
- Chinese
- Indian
- Italian
We used an online source to scrape the districts within Cambridge. After scraping the website we were left with 14 districts within Cambridge.
- Arbury
- Abbey
- Castle
- Cherry Hinton
- Coleridge
- East Chesterton
- Kings Hedges
- Market
- Newnham
- Petersfield
- Queen Ediths
- Romsey
- Trumpington
- West Chesterton
Cambridge districts
To make the GeoJSON file, that was used with our maps, we used the boundary relation numbers listed on the Cambridge districts website. Once we had these numbers we inserted them into this website which outputted a GeoJSON file for the district.
Polygon Creation
Then we combined all of our GeoJSON data for each district into a single GeoJSON file using Adobe Dreamweaver, adding the name of the district into the properties node of the GeoJSON file. With this data we find the centroid of each district to use as the center of our search radius.
For our venue data we used the Foursquare API. This allows us to make calls to the API to search/explore a region depnding on the latitude and longitude, categories, radius and limit when calling the API.
As we wanted to use multiple categories when searching the decision was to use the search API endpoint, explore will only allow a single category parameter when calling the API.
These are the Foursquare categories that we used:
- Food
- Entertainment and Nightlife spots
- Latin American Restaurants
- All other main categories
These categories will help us to define the data that we retrieve into allocated dataframes making it easier for us to visualise the data later.
The Foursquare does have limitations in terms of the maximum allowed venues that it will return upon each call to the endpoint. To achieve the greatest possible frequency of results we itterated through each district when calling our endpoint.
Our search radius was set to 1.5 km to ensure that our coverage was broad. This coverage map shows our districts with their search radius.
 Figure 1.1 - Map showing the search coverage of our districts, using 1.5km radius
We start by defining the center of Cambridge using GeoLocater.
Cambridge, UK Coordinates
| Latitude | 52.2034823 |
| Longitude | 0.1235817 |
These coordinates will be used to center our map.
Now we can get down to retrieving all of the data using the Foursquare categories that we have already listed.
To do this we need to define the process that will be carried out for each of our categories.
- Loop through our dataframe of districts and perform our search using the specified category. This will return a new dataframe for the specified category including venues for all districts.
- Sort dataframe by name.
- Drop duplicate rows, not by name, by the whole row. There are many chain restaurants who will have multiple locations, so we need to ensure that we do not delete these.
- Loop through our dataframe of venues and see which district boundary the venue falls within. If they do not fall within a district boundary we will assign a district of ‘None’.
- Delete any veneus that have a district of ‘None’.
- We will be left with a cleansed dataframe of venues.
The dataframes that we make using this procedure are:
- Restaurants
- Entertainment & Nightlight Spots
- Latin American Restaurants
- All other venues that do not fit into the above categories.
Before we move onto the analysis of the data that we have retrieved, it would be a good idea to view what we have gathered so far.
At this point we are only looking at the data so that it helps give us a bit of insight into the analysis that we will perform in the next section.
Please click on an image to view.

Figure 2.1 - Horizontal Bar Chart showing restaurant frequencies within districts
Figure 2.2 - Choropleth Map showing restaurant frequency within Cambridge, yellow markers incidate restaurant locations.
Figure 2.3 - Choropleth Map showing Latin American restaurants with the red marker, showing 500m radius with red circle
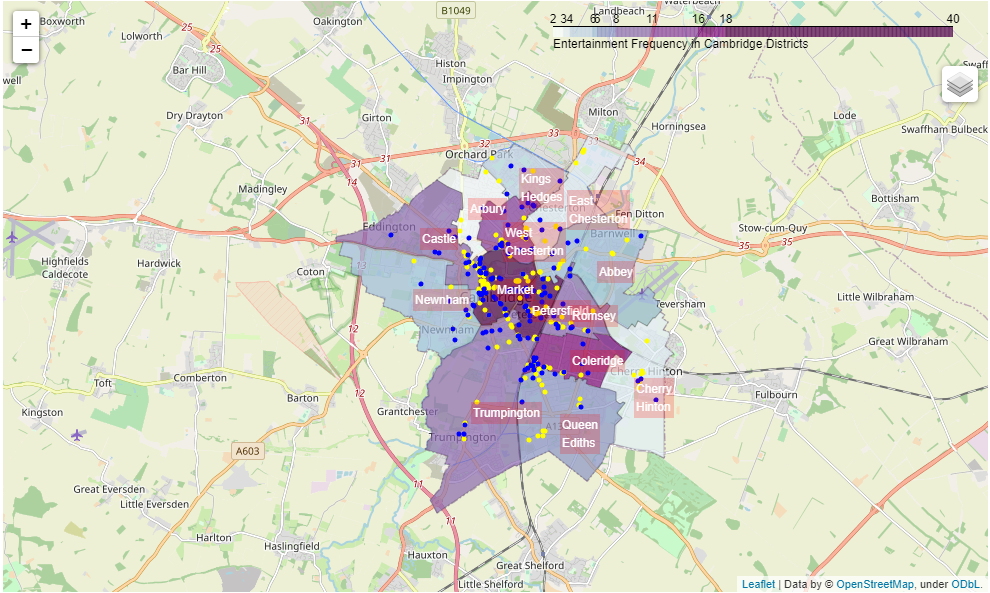
Figure 2.4 - Choropleth Map showing entertainment frequency within Cambridge, entertainment locations are the blue markers
Now that we have gathered the data from scraping, and from our geojson file we can start to analyise the results.
Data gathered includes:
- Districts
- Centroid locations for Districts
- DataFrame for All Venues within each District
- DataFrame for Restaurants within each District
- DataFrame for Entertainment within each District
- DataFrame for Latin American restaurants within each District
We also visualised that data retrieved in the form of Choropleth Maps, adding circle markers to the maps so we could see if there are any obvious clusters.
Our goal is to find the a suitable location for a new restaurant in a location where there are no Latin American restaurants and a populous entertainment and nightlife cluster.
In the analysis section we will use the following methods:
- Show that Cambridge fits into the same popular restaurant types as the rest of the UK.
- Clustering using K-Means our districts using the data we have for all venues within each district. This will help us to find the most populous districts for entertainment, we will then use this cluster to find appropriate locations.
- Scatter Plot using to show the correlation between restaurant and entertainment venues.
- DBSCAN Clustering will be used to find clusters in entertainment venues within a district.
The final product of the research will be to provide an address for each of the districts within the most populous entertainment cluster. The address will be located in the centroid position of the most populous entertainment cluster for each district, and not within 500m of a competing Latin American restaurant.
In this section we hope to show suitable locations for the Peruvian Restaurant.
To start we will confirm that Cambridge does follow the normal trend in most popular restaurants compared to the UK.
Then we will cluster the districts into similar clusters using K-Means.
After that we will see if there is a correlation between the frequency of restaurants and entertainment venues.
Following on from that using DBSCAN we will find the cluster with the densest entertainment venues within the k-means cluster that we have chosen to look into. This will be used later to find the ideal location for the restaurant. The clustering will use the Latitude and Longitude of the entertainment venues.
Lastly the final anaylsis will be to find the ideal locations, we will get the mean of the most popular clusters from the DBSCAN step. This will get us a centralised latitude and longitude for the cluster, then we will need to confirm that this is not within a 500km radius of any other Latin American restaurant.
As of current statistics these are the 5 most popular restaurant cuisines in the UK:
- Pub Food
- English
- Chinese
- Indian
- Italian
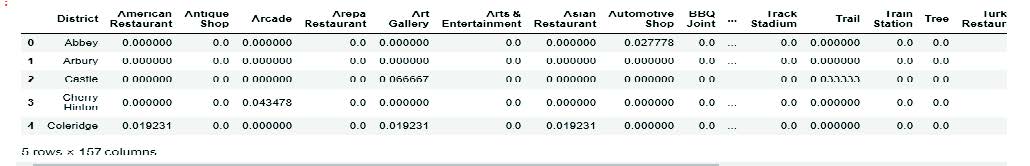
This data was found earlier, now we need to check the top 10 restaurant categories within Cambridge. Our data tells us that there are 47 unique restaurant categories within Cambridge.
When we group by restaurant category and perform a count function we are display with the following information:
- Café - 30
- Coffee Shop - 21
- Chinses - 14
- Indian - 10
- Food Truck - 8
- Fast Food - 8
- Bakery - 7
- Gastropub - 7
- Pizza Place - 6
- Restaurant - 6
Looking at the list of top 10 restaurants, we can clearly see there are some that should be removed as they do not fit into the restaurant category.
- Chinese - 14
- Indian - 10
- Gastropub - 7
- Pizza Place - 6
- Restaurant - 6
Once we have stripped away the food venues which do not fit into the restaurant category we can start to see the frequency shaping up in the way that we would expect.
However, the pub category has a very small frequency. Where are all the pubs?
Looking at the entertainment dataframe it shows that pub has the maximum frequency. Therefore we must merge both dataframes to get a more accurate result.
After the merge our new frequency distribution table shows that the top 5 (after removing nonrestaurants) is the following:
- Pub/Gastropub - 65
- Chinese - 15
- Indian - 10
- Pizza/Italian - 9
This shows us that the UK most popular restaurant type data that we aquired earlier is correct for Cambridge.
One of the categories is missing, being English Restaurant, but that maybe due to the categories of Foursquare not being completely accurate.
There are restaurants listed within our Foursquare search, maybe they are English. If we were to include them into our frequency distribution table English would be placed in 5th place with a frequency of 6.
As we do not know the exact category of Restaurant within our dataframe we will not include this in our table.
In this section we will look at clustering the districts using K-Means. K-Means nearest neighbour is a machine learning function that takes a set of numerical data and clusters the data into clusters depending on the K number that you have defined.
To perform a K-Mean cluster we need to use One-Hot-Encoding to turn our venue categories into numerical data. At the moment it is in our dataframe in a text format. One-Hot-Encoding will transfrom the category into a new column within our dataframe and add a 1 to the column that we have created.
As we want to include all data, not just restaurant and entertainment venues to find similar districts, we combine our three dataframes from earlier (all venues, restaurant and entertainment)
After performing One-Hot-Encoding, and grouping our data by district, our dataframe looks like this.
One-Hot-Encoding Report groups by district.
Before we fit our dataframe using K-Means, it would be useful to visualise what our K number should be. This is called K-Optimization, and we use a line chart called a K-Elbow.
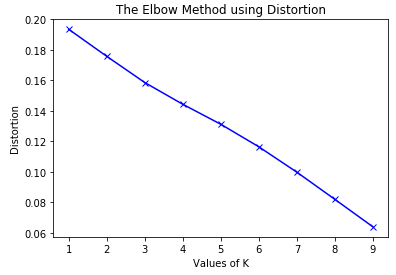
Figure 4.1 - K-Elbow line charts displaying Distortion Method
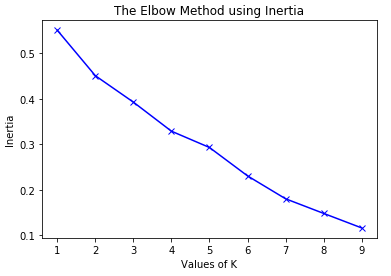
Figure 4.1 - K-Elbow line charts displaying Inertia Method
As K-Means works by selecting a random centroid for each cluster, if you repeat the functions it will change everytime. After running our function several times the most positive K number was 4 as it was regulary elbowing.
Our diagram is showing that the data within our dataframe is pretty similar. If there were clear differences in our data between districts we would expect to see a more defined K-Elbow.
After performing our K-Means function on our data using a K of 4, we end up with the following clustering of distrcits.
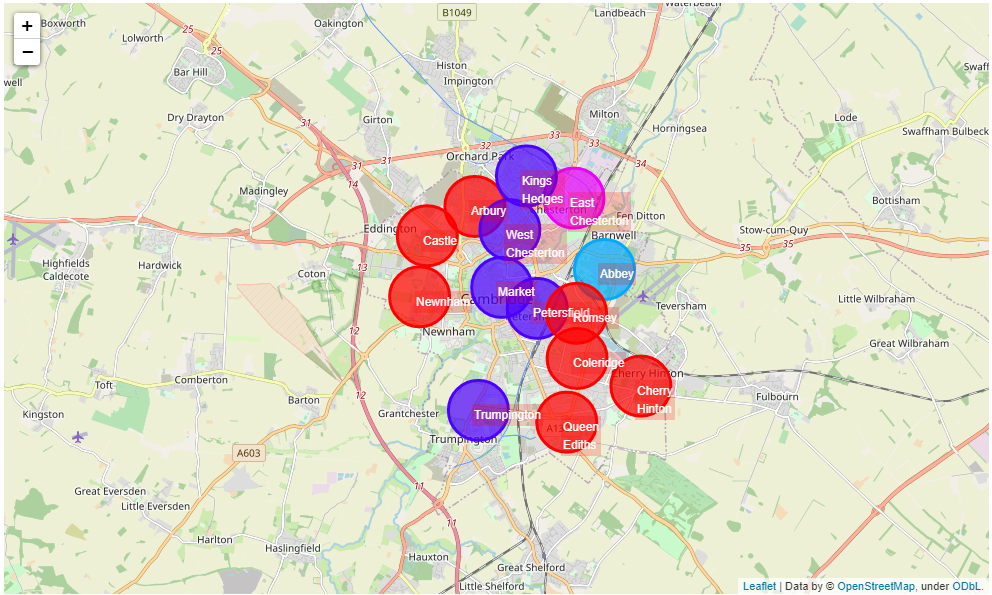 Figure 4.2 - K-Means Neighbour Clustering Diagram - Districts divided into 4 clusters using restaurants,entertainment and all other venues
The cluster with the most entertainment venues will be used in our final analysis, where we find the addressess of appropriate locations for the stakeholder.
By choosing an area that is dense in entertainment and nightlife spots, will the stakeholder also have to endure competition from a higher proportion of restaurants?
By default, most people will say yes to this question, as it appears obvious. Let us find out whether this is correct.
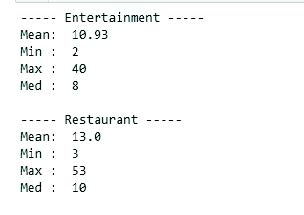
To start we will group our restaurant and entertainment dataframes by district and perform a count function.
For curiousity we also calculated the max, min, median and mean of both dataframes.
Bar Chart
From our bar chart chart we can see that the 3 districts with the most frequency of restaurants are also the top 3 districts for entertainment venues too.
Does this mean that there is correlation between the two?
To provide more detailed analysis, we can use a scatter plot, to see whether there is any type of linear regression.
Linear Regression Scatter Plot
In the scatter plot we can clearly see that there is a linear regression line showing correlation. Our 95% confidence interval gets wider the more frequent in restaurants and entertainment venues. This is due to not having enough data at the top end, there is a big difference in frequency between the top district and the second district.

Figure 4.3 - Horizontal Bar Chart displaying restaurant and entertainment frequencies within the 14 districts

Figure 4.4 - Scatter plot showing Linear Regression line with 95% confi dence intervals either side of the line.
we can find the most suitable address for the new restaurant, we need to locate which cluster of entertainment venues, within a district, is the most populous.
When we clustered our districts earlier we did so to narrow our search for the best districts. After the clustering we were left with 4 clusters, and looking at the data and districts that already contain Latin American restaurants, we decided to use Cluster 2 which contained 5 districts.
- Market
- Petersfield
- West Chesterton
- Trumpington
- Kings Hedges
The original plan was to find the top 5 most populous districts within our cluster, but our cluster only contains 5 distrcits anyway.
Firstly we will use a scatter plot to find the density of entertainment venues according to Latitude and Longitude This will help us to find the areas with the most venues. To display the clusters we will use the DBSCAN method.
DBSCAN does not need to be told how many clusters to use, instead it uses EPS and minimum sample size to calculate.
DBSCAN uses the EPS to look within a radius of the points and work out whether another point is within this radius. If it is within the radius then that point is added to the cluster, then the method moves onto the next point etc. until it gives you clusters.
The following images show the results of our DBSCAN clustering on our 5 selected districts.
DBSCAN Scatter Plots - From our 5 selected Districts
Please click on an image to view.
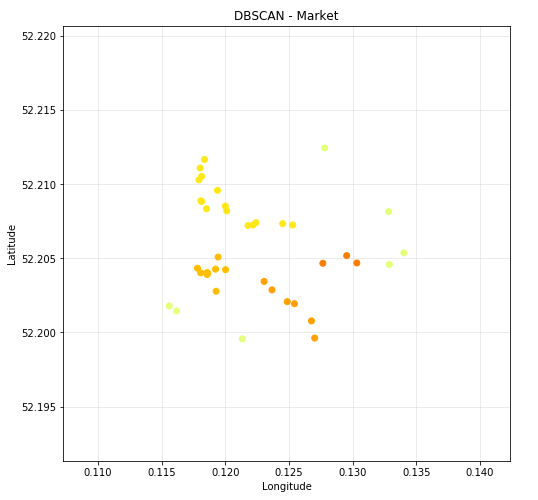
Figure 4.5 - DBSCAN - Market (Latitude and Longitude)
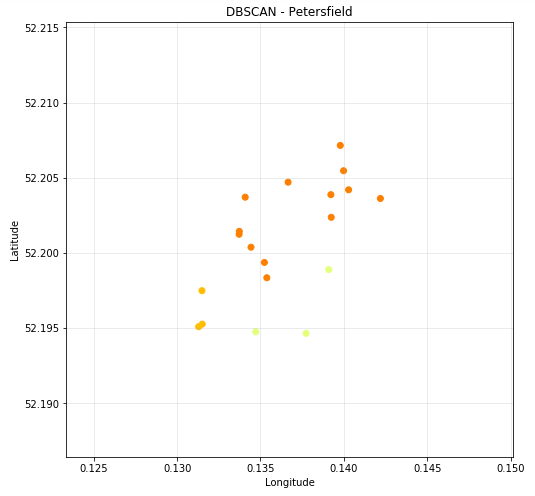
Figure 4.6 - DBSCAN - Petersfield (Latitude and Longitude)
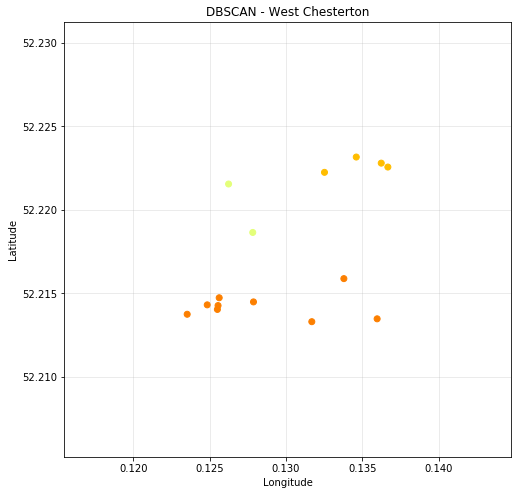
Figure 4.7 - DBSCAN - West Chesterton (Latitude and Longitude)
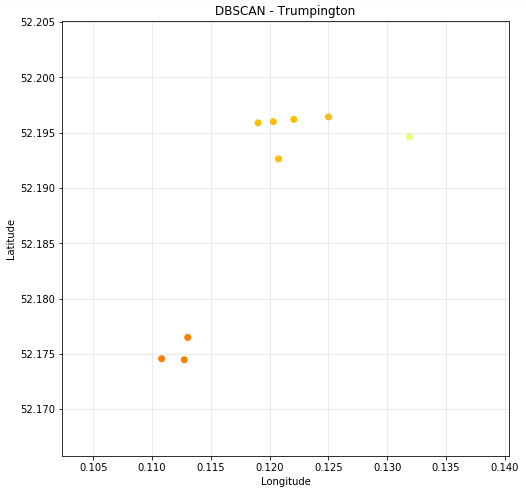
Figure 4.8 - DBSCAN - Trumpington (Latitude and Longitude)
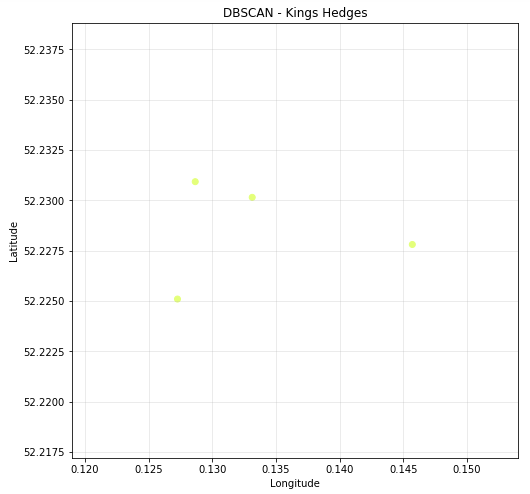
Figure 4.9 - DBSCAN - Kings Hedges (Latitude and Longitude)
Now that we have the infromation from the scatter plots, we can see that the most poulous clusters for entertainment are:
- Market - Cluster 0 (15)
- Petersfield - Cluster 1 (13)
- West Chesterton - Cluster 1 (9)
- Trumpington - Cluster 0 (5)
- Kings Hedges - Cluster -1 (4)
Kings Hedges does not have many entertainment venues, and are not located in clusters, therefore we will just use all 4 points when calculating the perfect location.
This is our final analysis, and the purpose for the research. We will be taking our 5 selected districts, and the cluster of most populous entertainment venues to find an address at the centre of this cluster. The restaurant must not be within a 500m radius of any existing Latin American restaurant.
Using the latitude and longitude from the cluster of entertainment venues, we first calculate the centroid position. As the distance is very small between the entertainment venues we can take the mean of the latitude and longitude positions.
If we were calculating this over larger distances we would need to use a different method, to allow for the curvature of the earth.
The mean position that we have got for each district will be our desired location for the new restaurant. Let us check to make sure that the locations are suitable. Entertainment venues from our cluster are shown in blue
Figure 4.10 shows that our ideal location within Market falls within the 500m radius of a pre-existing Latin American restaurant. We will need to find a location outside this radius. Let us see how far away the restaurant is to our point by looping through the Latin American restaurants and comparing the distances.
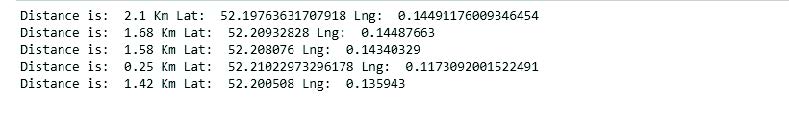
As we are only talking a very small distance, in this case 250m, that we have to move our restaurant, we can take the bearing between the Latin American Restaurant and our ideal location.

Let us move the point on this angle 500m from our Latin American restaurant. This leaves us with our final position.
Market - Map showing Ideal Location
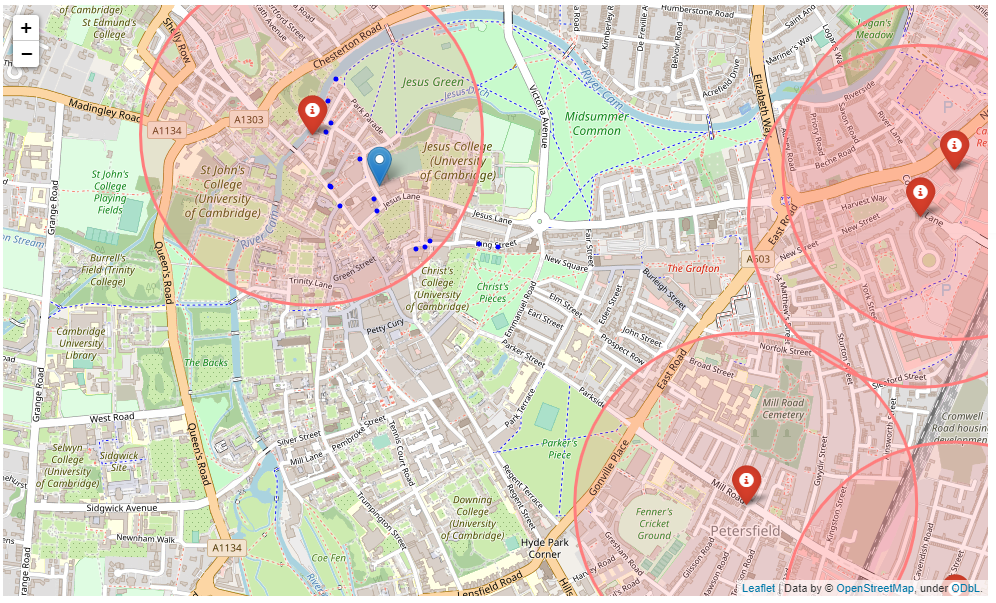
Figure 4.10 - Map showing the ideal location for a restaurant in Market - Location is within 500m of existing Latin American Restaurant
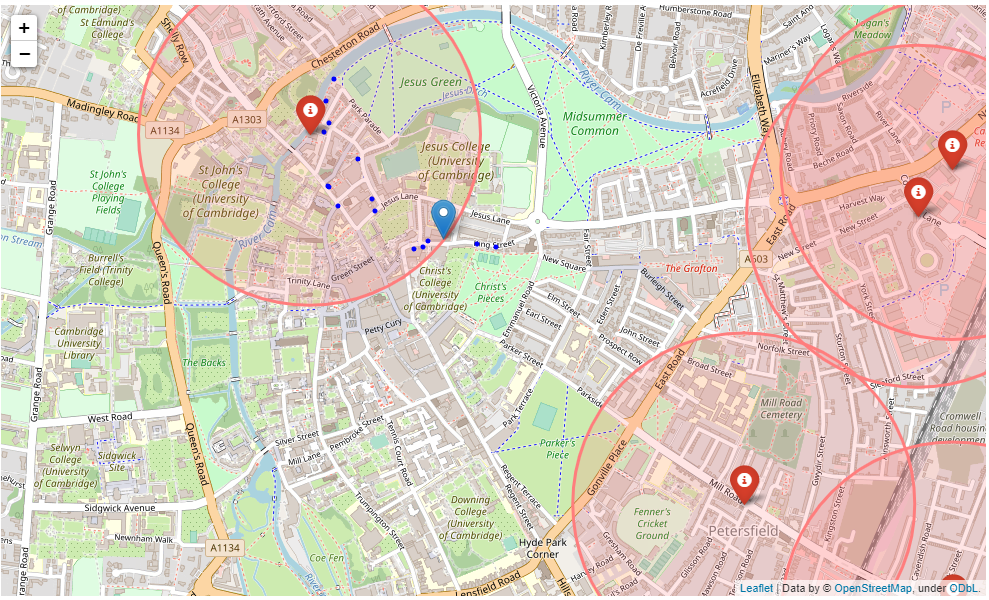
Figure 4.11 - Map showing the ideal location for a restaurant in Market after we move the location point.
Let’s repeat this for the remaining neighbourhoods, and if neede we will impliment the same process to move our new point.
Maps showing Ideal Location for remaining districts
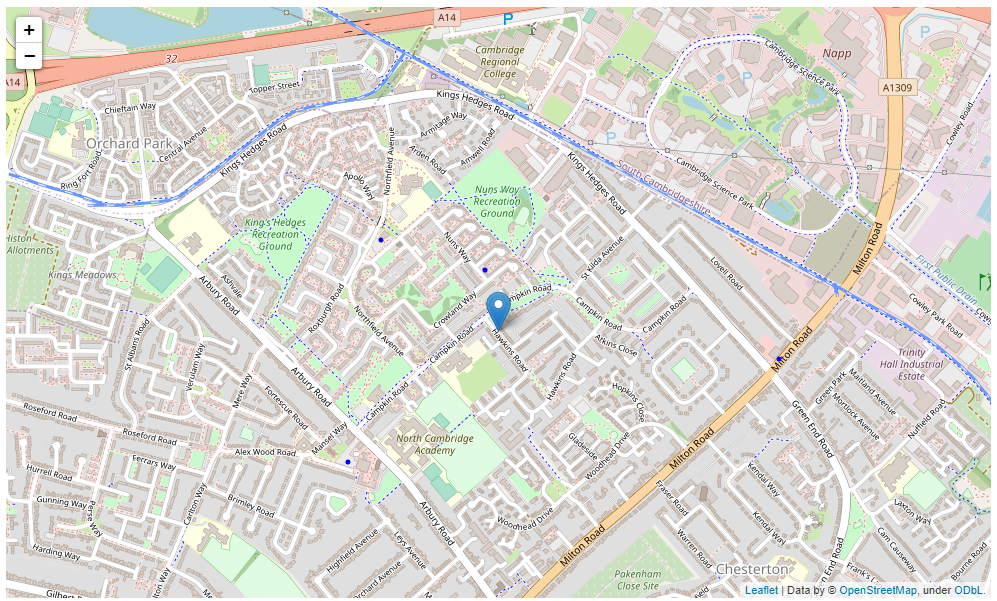
Figure 4.12 - Map showing the ideal location for a restaurant in Kings Hedges
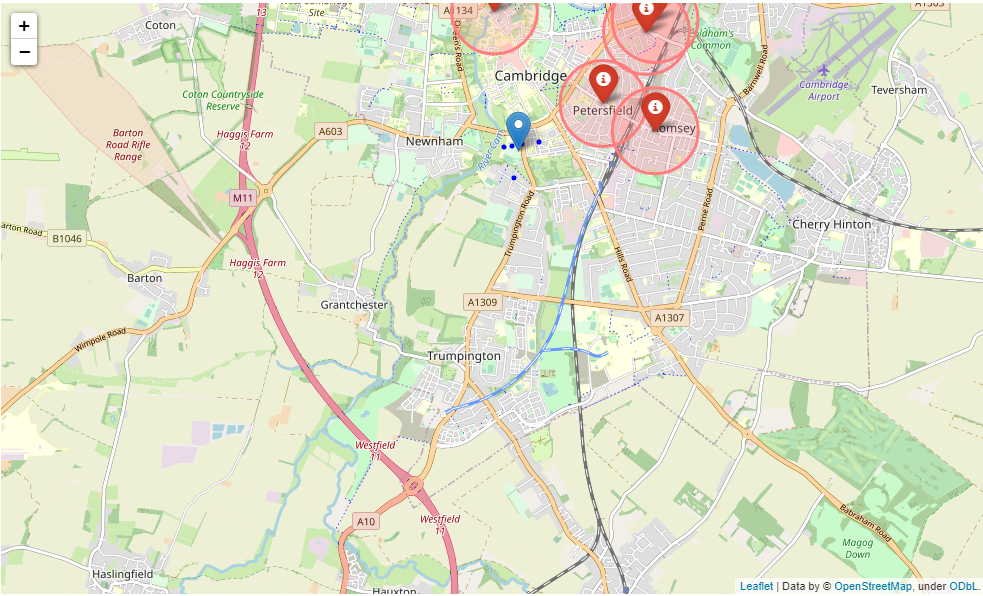
Figure 4.13 - Map showing the ideal location for a restaurant in Trumpington
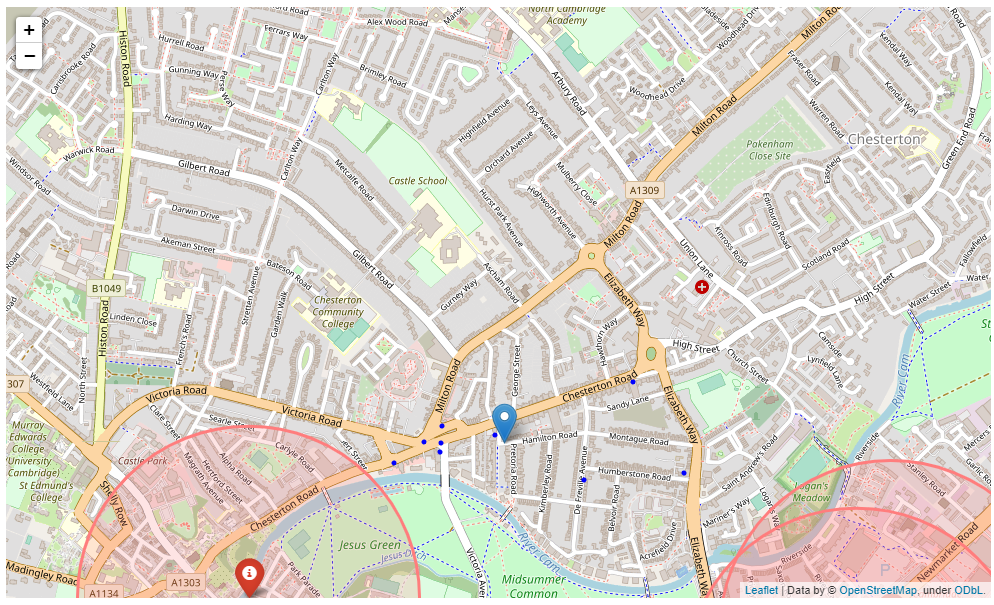
Figure 4.14 - Map showing the ideal location for a restaurant in West Chesterton
Petersfield - Map showing Ideal Location
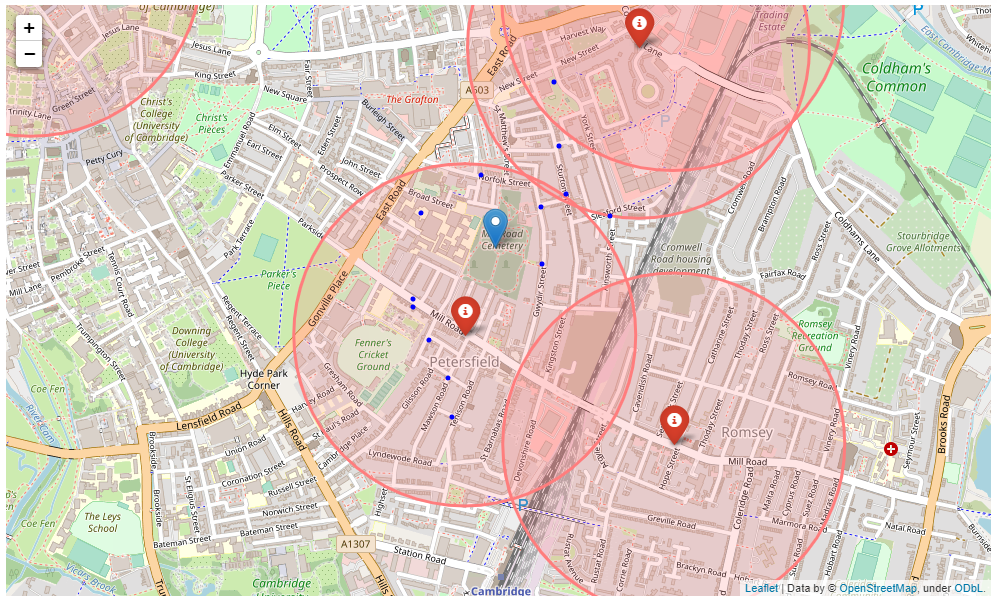
Fig 4.15 - Map showing the ideal location for a restaurant in Petersfield - Location is within 500m Radius.
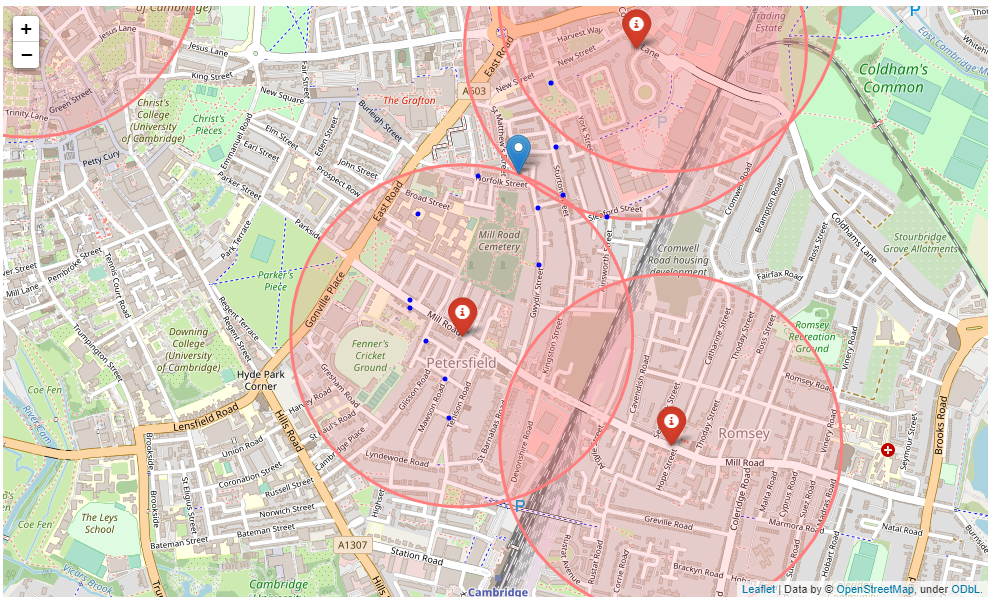
Fig 4.16 - Map showing the ideal location for a restaurant in Petersfield after moving location of point outside 500m radius.
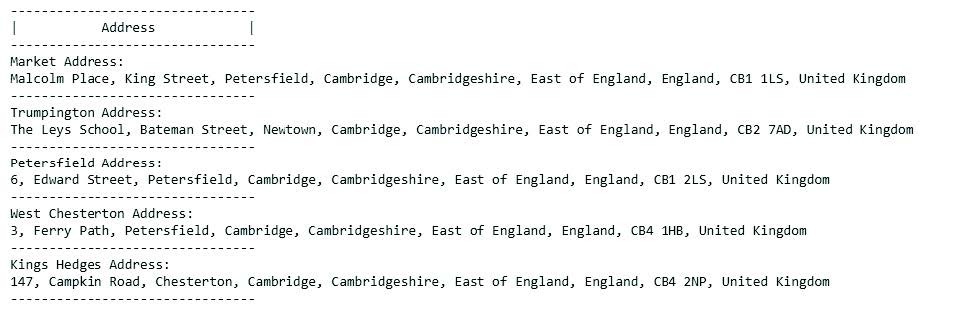
Now that we have a latitude and longitude point for each of our 5 districts, lets use these points to find the address.
To do this we use the Geopy library, by providing the latitude and longitude points it will give us an address.
These are the results that we have taken from our analysis. At the start of the analysis section we set out to show the following:
From examining the results that we achieved we can see that in general Cambridge does fit with the overall UK top restaurant list.
We noticed that pubs were not included in the food category, so we had to combine restaurants and entertainment dataframes to include pubs in the tally.
Once we included entertainment our sample data looked like the following, only including categories listed in the top 5 report:
- Pub/Gastropub (65)
- Chinese (15)
- Indian (10)
- Pizza/Italian (9)
This shows a close correlation to the UK top 5 that we have found:
- Pub Food
- English
- Chinese
- Indian
- Italian
In this section we used K-Means to make clusters to show similarities within Districts. For this we used a DataFrame which uses all venue type frequencies listed for all 156 unique categories.
To make sure that we optimised our K-Means cluster we created a K-Elbow diagram for Distortion and Inertia. This model did not really show us a K-Elbow with a defined elbow, but from the diagram we decided to use a K number of 4.
The resulting clusters were as follows:
- Arbury
- Castle
- Cherry Hinton
- Coleridge
- Newnham
- Queen Ediths
- Romsey
- Abbey
- Kings Hedges
- Market
- Petersfield
- Trumpington
- West Chesterton
- East Chesterton
As the majority of current Latin American restaurants are located in Cluster 2 it was selected to research further.
One of the criteria was to find an area with a high density of entertainment, so we used the top 5 districts for entertainment frequency. In this cluster, we only had 5 available districts, the final selected districts were:
- Kings Hedges
- Market
- Petersfield
- Trumpington
- West Chesterton
The information gained from our sample data shows that there is a correlation between restaurant and entertainment venue frequency. Using our horizontal bar chart we can show that there is in the majority of instances more restaurants than entertainment venues, with a couple of outliers.
Using a scatter plot we were able to plot a linear regression. To create a more accurate regression line there would need to be more diversity in the frequencies. Currently there is a big interval between the most populous district and the second most populous district.
As we want our venue to be located near a populous area for entertainment venues we can try to find the most suitable location.
Now that we have the results from the clustering narrowed our search to 5 districts. Using DBSCAN to create a scatter plot with latitude and longitude points for the entertainment venues within the districts we created a cluster of entertainment venues.
We took the cluster information and used it to create a list of the venues within the most populous cluster of venues. This information will be used to calculate the ideal location within the districts.
In the last stage we took the mean of all of the coordinates from our list of entertainment venues within the prefered cluster and calculated the mean coordinate. With this mean coordinate for our three chosen districts we got the following addressess:
King Street,
Petersfield,
Cambridge.
CB1 1LS
Bateman Street,
Newtown,
Cambridge.
CB2 7AD
Petersfield,
Cambridge.
CB1 2LS
Petersfield,
Cambridge.
CB4 1HB
Chesterton,
Cambridge.
CB4 2NP
These locations can be used by the stakeholder to inform the letting agent of the ideal location that they would like to find a restaurant.
From the results achieved it can be seen that there are other factors we could use to find a more suitable district, if we feel that our research was not details enough.
For instance, as the comparison between the UK top 5 and Cambridge top 5 is very similar we could cluster more neighbourhoods from other citys to get more accurate clusters.
Cambridge is a fairly small city as we can see from the frequency of restaurants. Perhaps this research could be calculated using a larger city, for instance London, where we could increase the sample size radius and then using our clustering model we could use it on Cambridge.
Another approach could be to take the restaurants and entertainments coordinates and perform a DBSCAN to find the clusters with the densest of both items to make our search regions, rather than using districts. As the stakeholder wants to find an area with a high density of entertainment venues we can assume, from our correlation information, that the area will also be dense with restaurants too.
Another option would be to take the ratings of the entertainment venues within Cambridge and only select venues which are above a certain rating. This would mean that we could ensure that our chosen locations are within a cluster of top rated venues.
Lastly, we could look at the mean lease price for retail outlets within these districts so that the stakeholder can see the financial implications too.
Our research goal was to find suitable districts for the stakeholder’s new restaurant, and to locate and area within the district which would be most suitable, and do not have a Latin American restaurant within 500m.
From our results we can see the following:
Cambridge follows the UK in terms of the most popular restaurant types. This could help us with further research if required.
There is a clear correlation between the frequency of restaurant and entertainment venues, so if the stakeholder wants a high density of entertainment venues they will have more competition from other restaurants.
Of the addressess that we retrieved from our final analysis, the most suitable appears to be in Market with the highest cluster of entertainment venues (15) situated in close proximity. The Market area also has a high density of restaurants, and we can make an assumption that due to the densities of both restaurant and entertainment venues the lease price in the area will be the highest.
Market with an entertainment total of 40 and a restaurant total of 53 clearly shows that Market is the most populous in both aspects having the max in both charts.
| Mean | 10.93 |
| Min | 2 |
| Max | 40 |
| Med | 8 |
| Mean | 13 |
| Min | 3 |
| Max | 53 |
| Med | 10 |